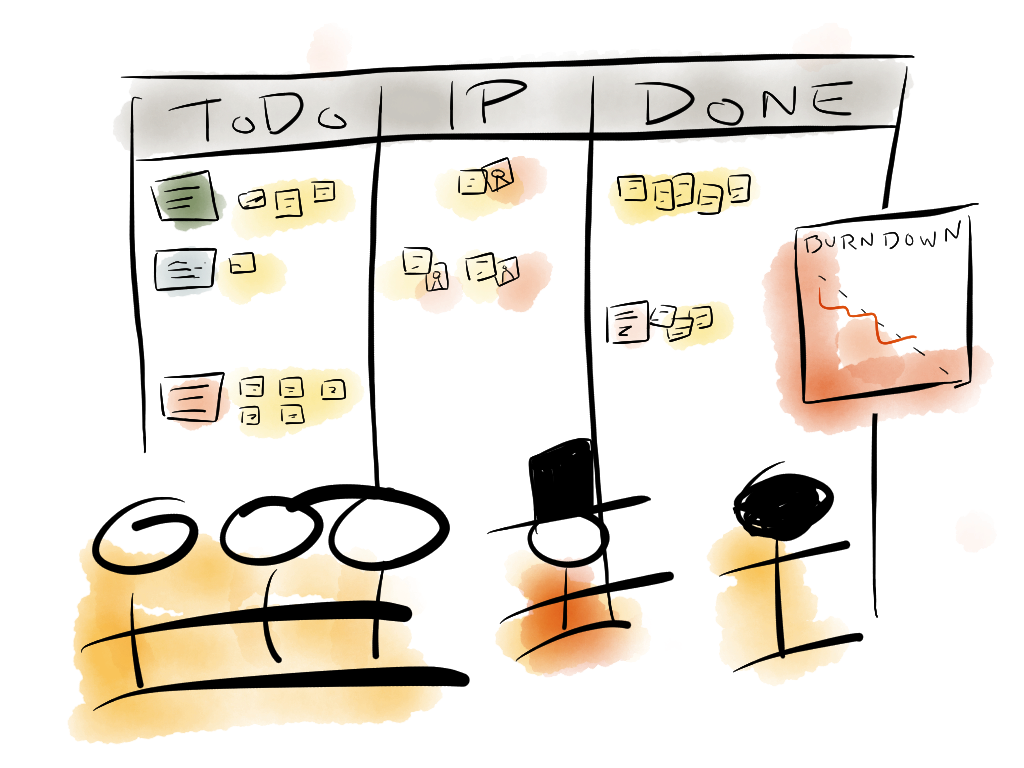
 When keeping track of the sprint burndown it’s often good (or ever required) that you show that process on a daily bases. In my case I have a wiki page for each sprint and want to have the daily burndown there updated every day.
So I created a simple Google Spreadsheet for Sprint Daily Burndown. There I create a new tab for each sprint using the TEMPLATE as the base (or just duplicate an old one).
How to set this up
We were running weekly sprints so there are only 5 days on the template now.
- Start off by duplicating the TEMPLATE sheet (the small triangle on the right site of the Sheets name).
- Set the Sprint name
- Fill out the total plan (story points) in the first Planned remaining column (C3), this is your total burndown “plan” for the sprint.
- Then you have to set how much you plan to have burnt the first day in the second column of Planned Daily Burndown (D4). The reason for this is that we had SPM on Mondays so the planned burndown was always lower on Mondays and we decided that each sprint 😉
- The rest of the Planned Daily Burndown is just divided evenly automatically, but you can change that if you need to.
- Then every day you insert the Daily Burndown on your Daily Standup Meeting (Daily Scrum) accordingly and the Chart below is updated.
Sharing the Chart
The sweet part is that you can publish the Chart as an image and place on your wiki or webpage and the image is update each time you fill out new numbers. Very handy when you have a sprint page that you wan’t to display the process of the sprint =)
- Click the chart and in the right corner click the triangle and select Publish chart
- In the Select a publish format select Image
- Copy the URL for the image and pate wherever you desire =)
Feel free to make a copy and edit your own, I’d love to hear if this helps or if you anything else to tell me about this 😉

If you request access to the document I’ll just reply that you should make a copy, since I don’t want someone changing the template…and I don’t think you wan’t anyone messing with your data 😉